监控告警
如何在 Pigsty 中对基础设施进行自监控?
Module:
Categories:
监控面板
Pigsty 针对 Infra 模块提供了以下监控面板
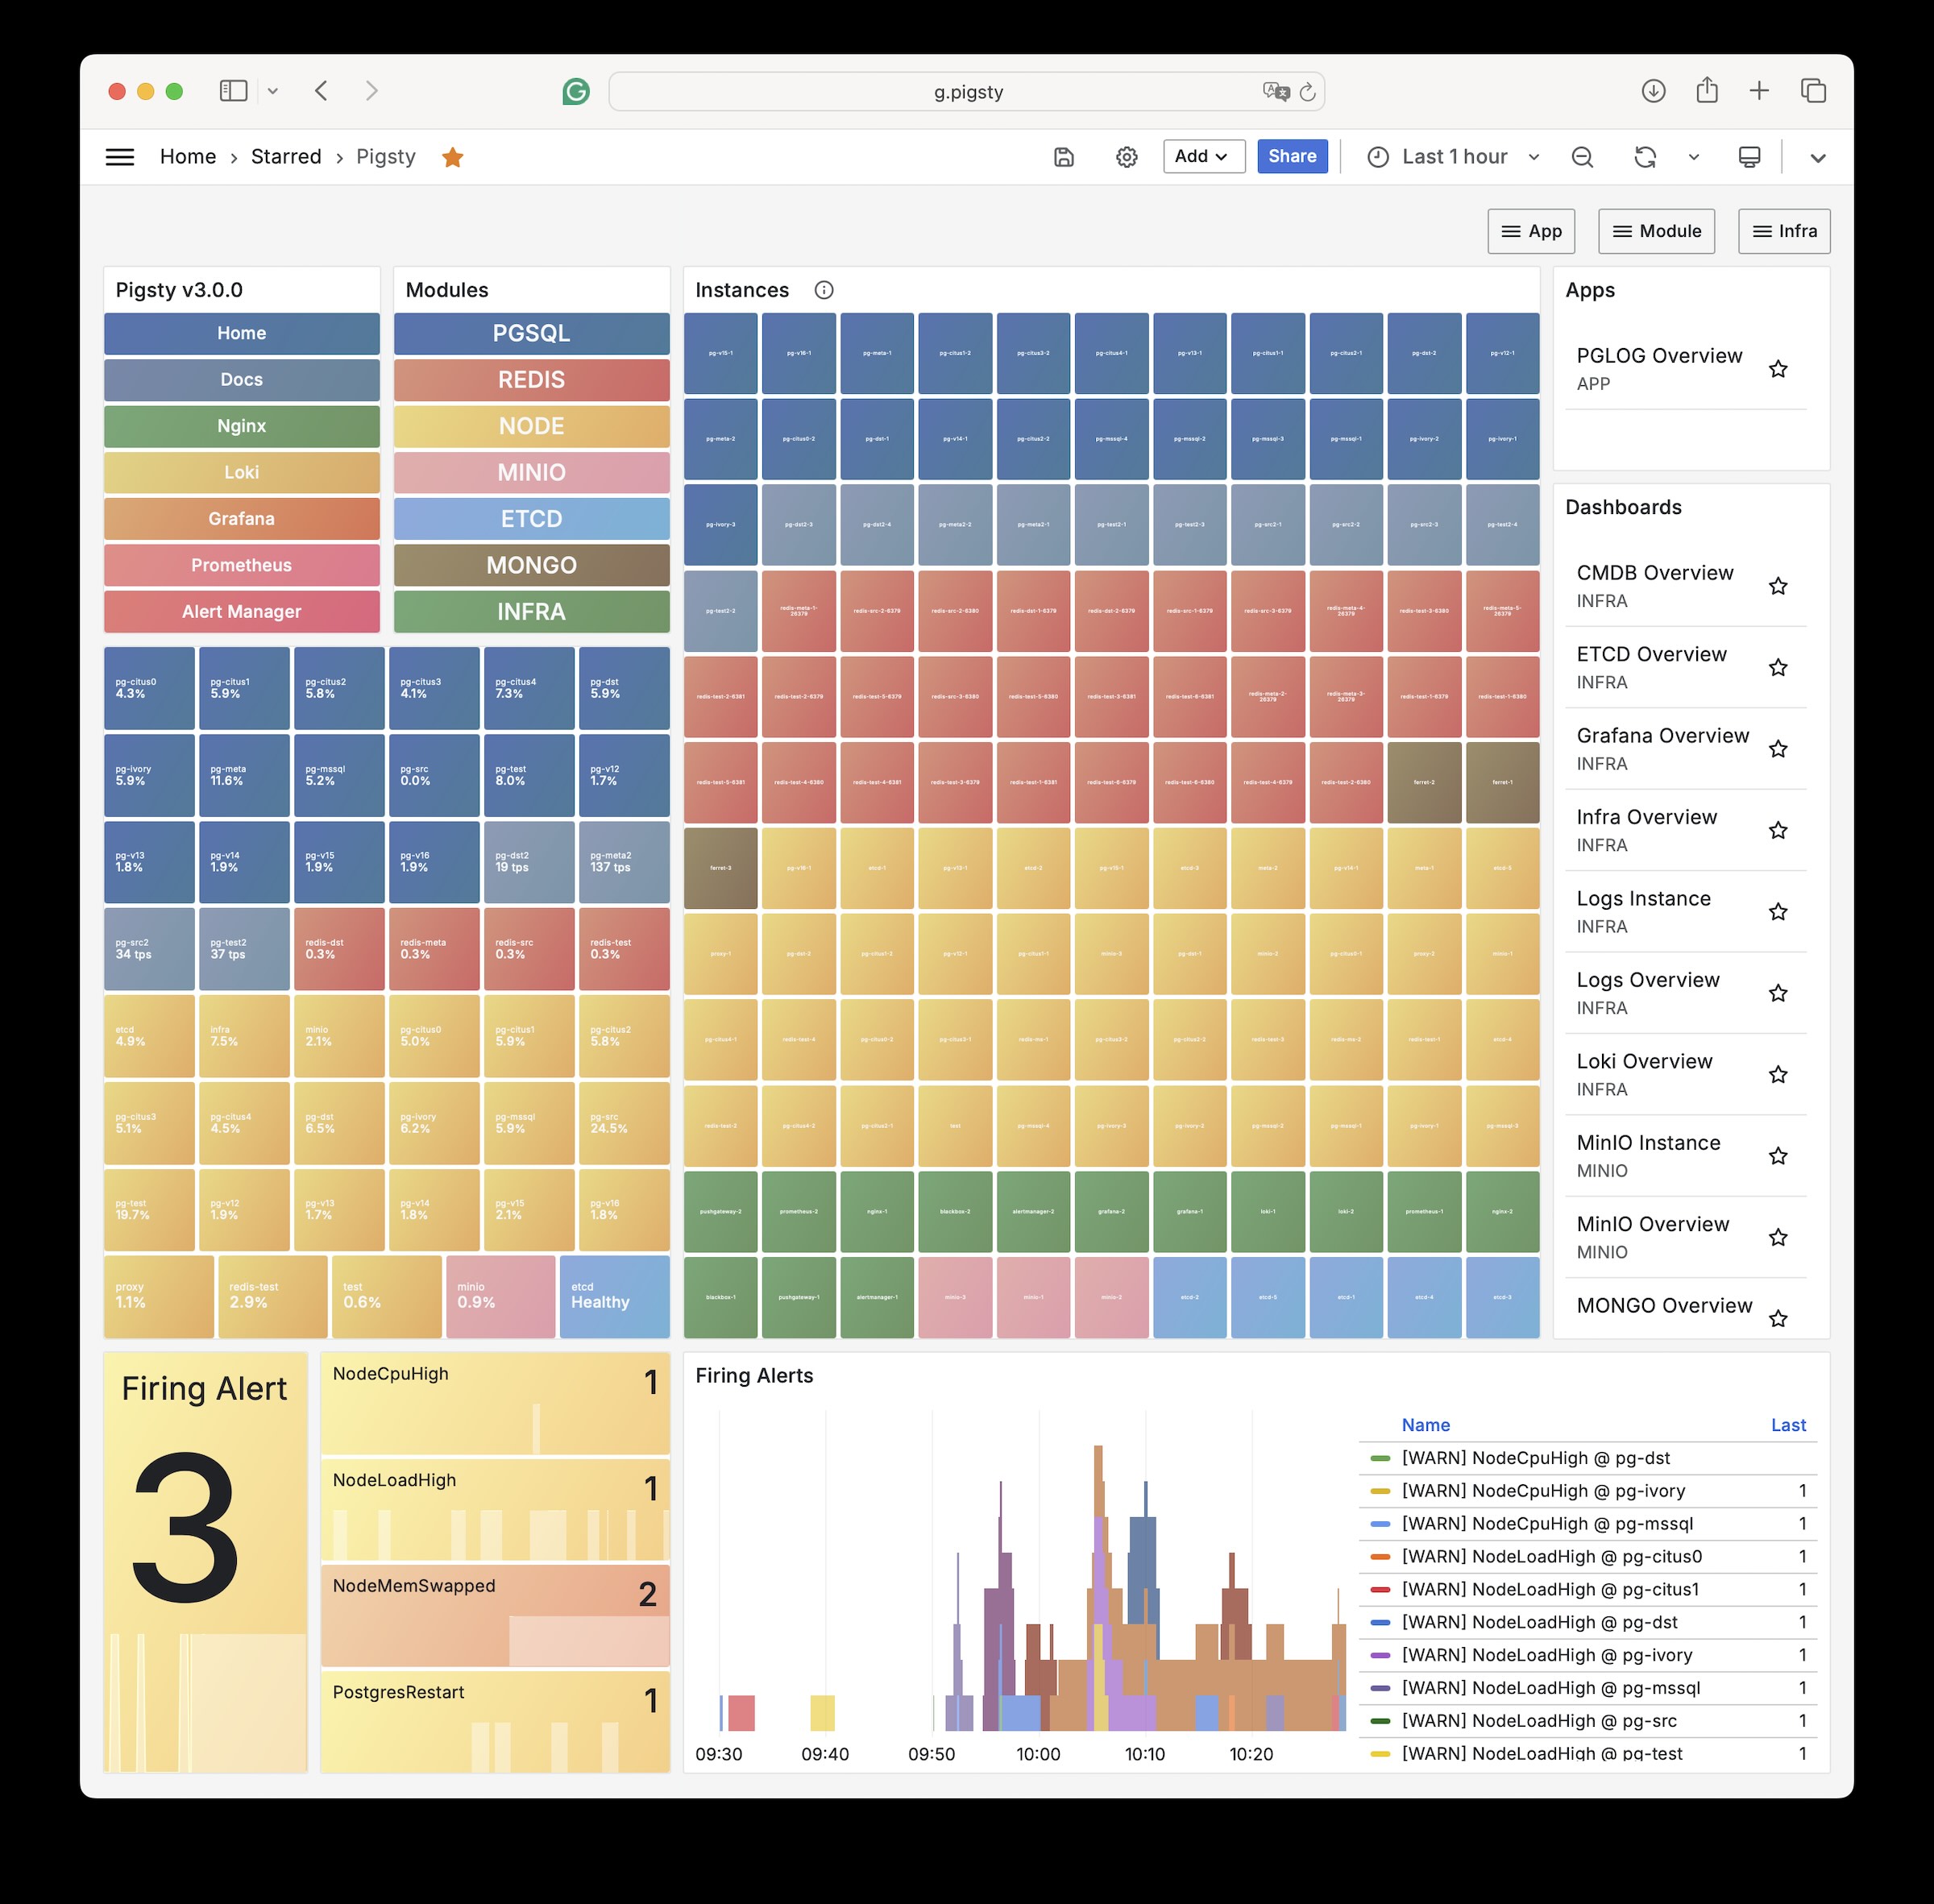
Pigsty Home
Pigsty 监控系统主页
Pigsty Home Dashboard
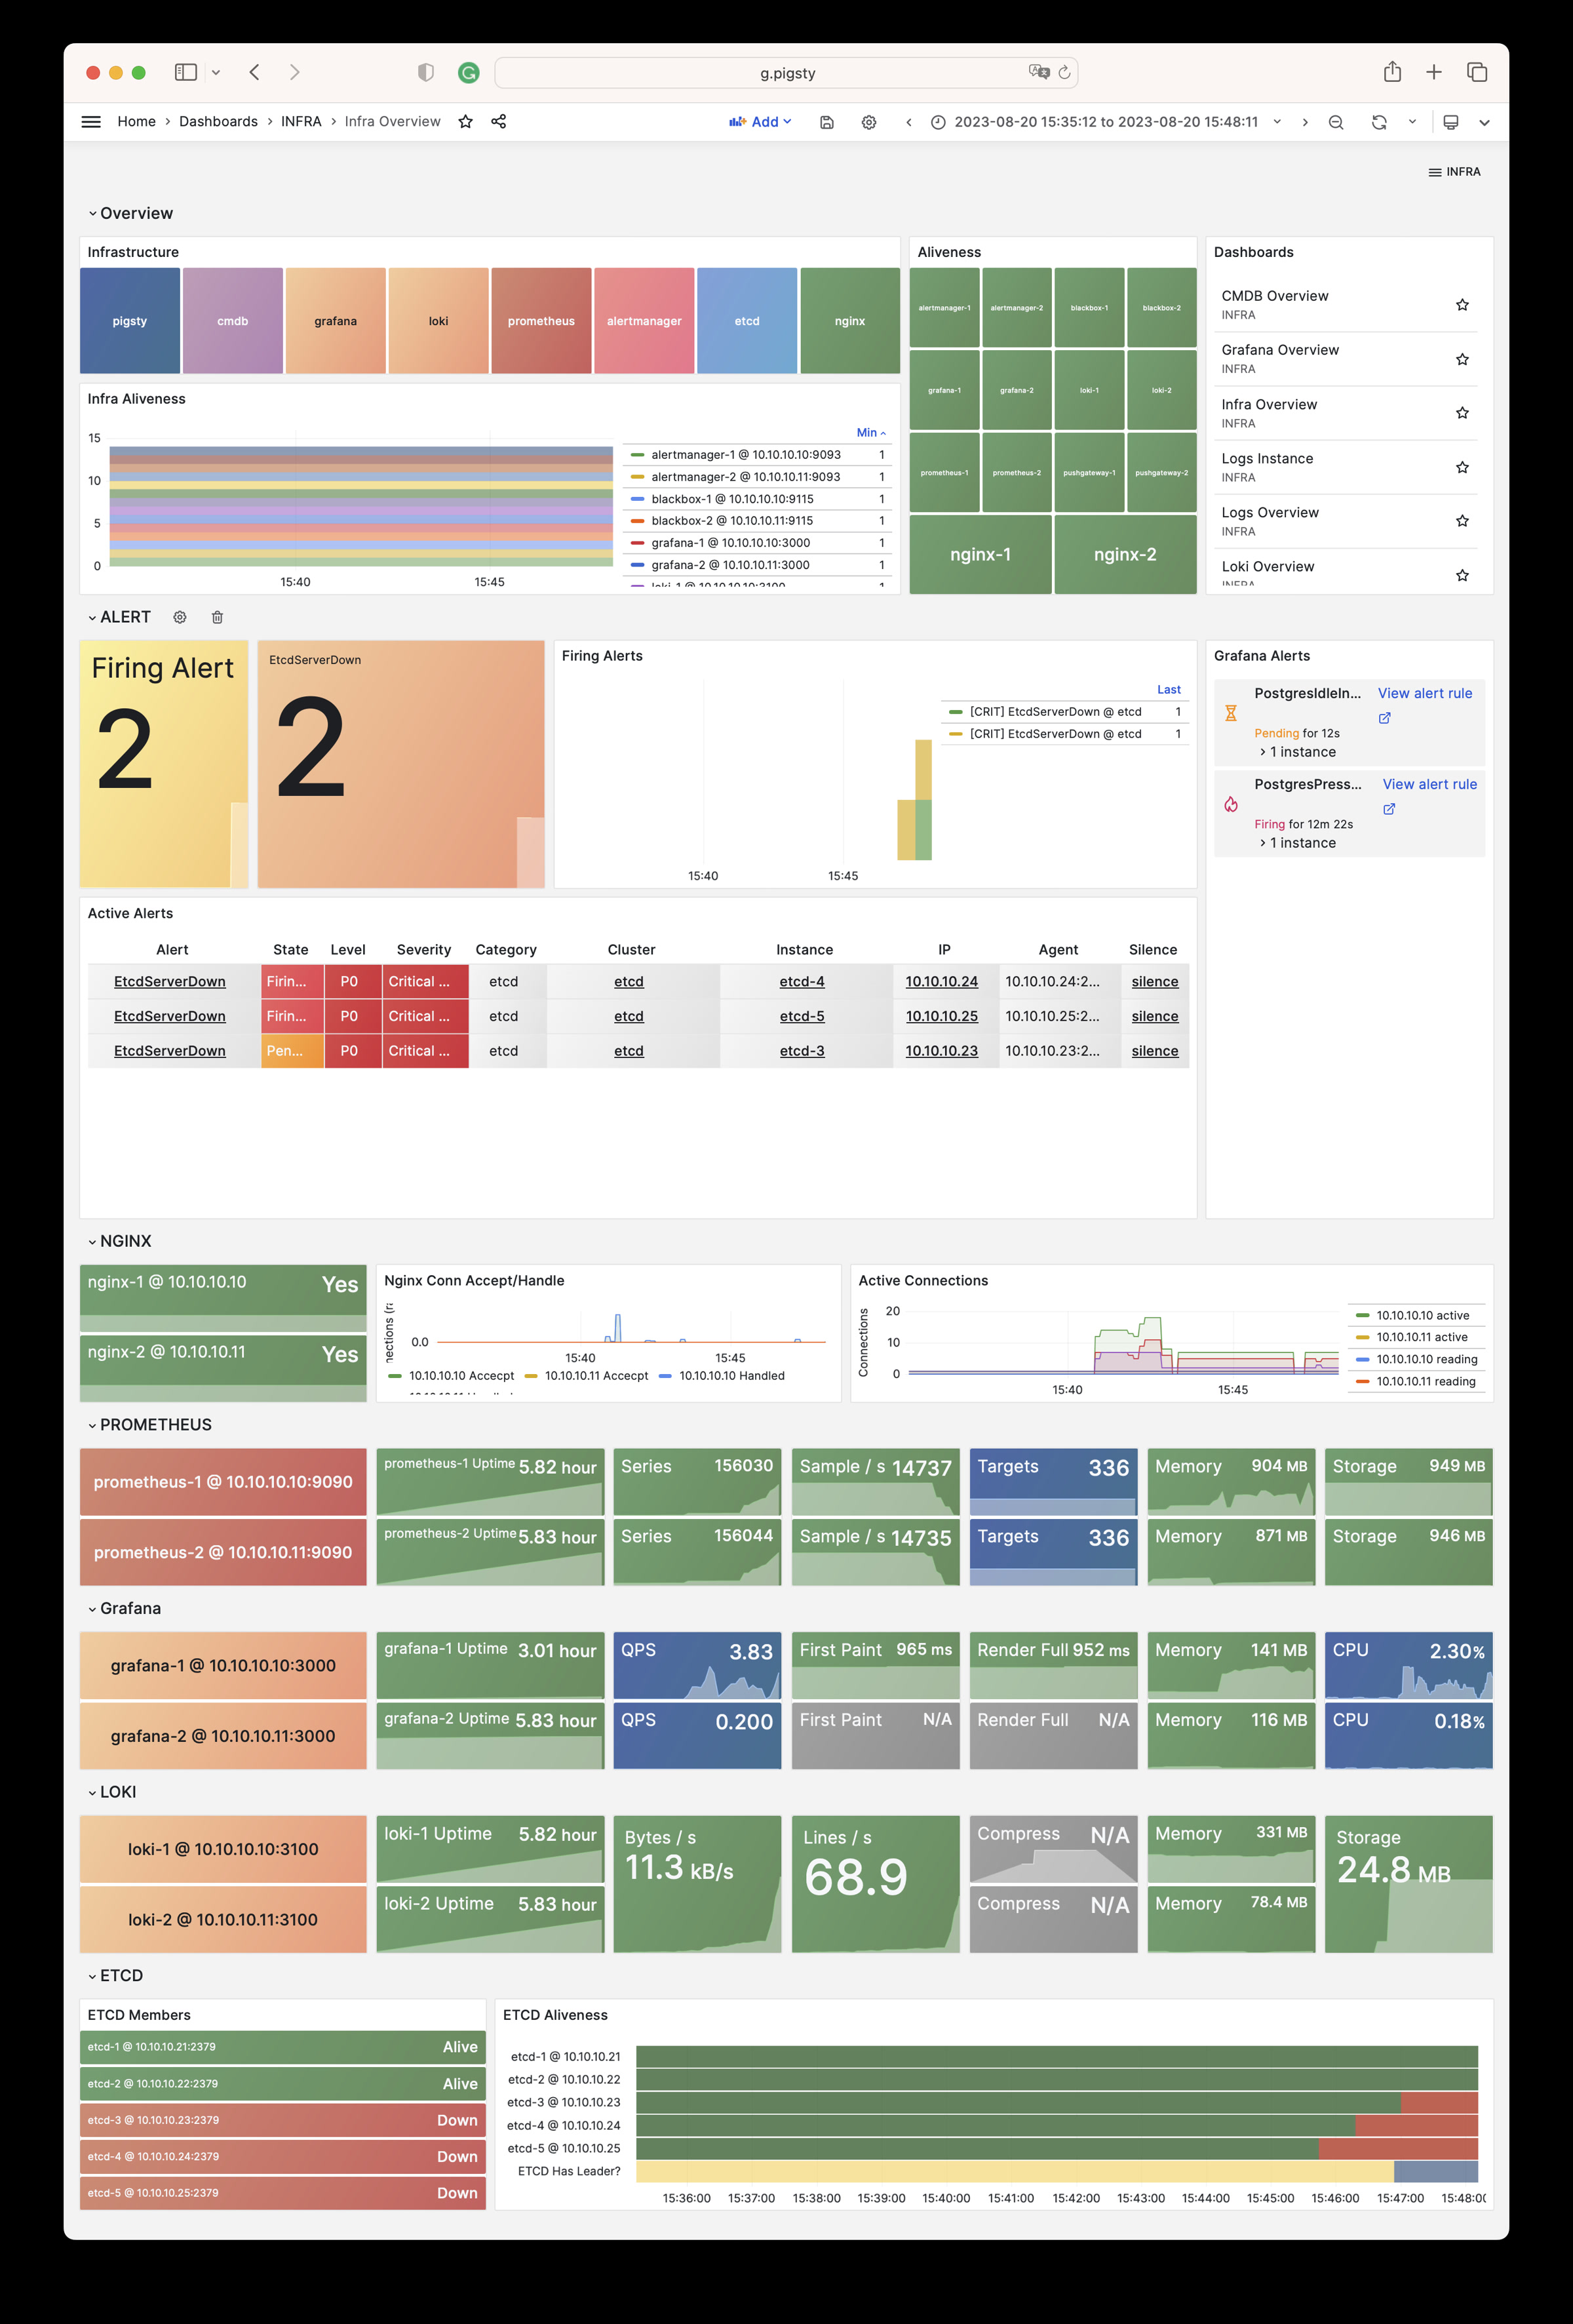
INFRA Overview
Pigsty 基础设施自监控概览
INFRA Overview Dashboard
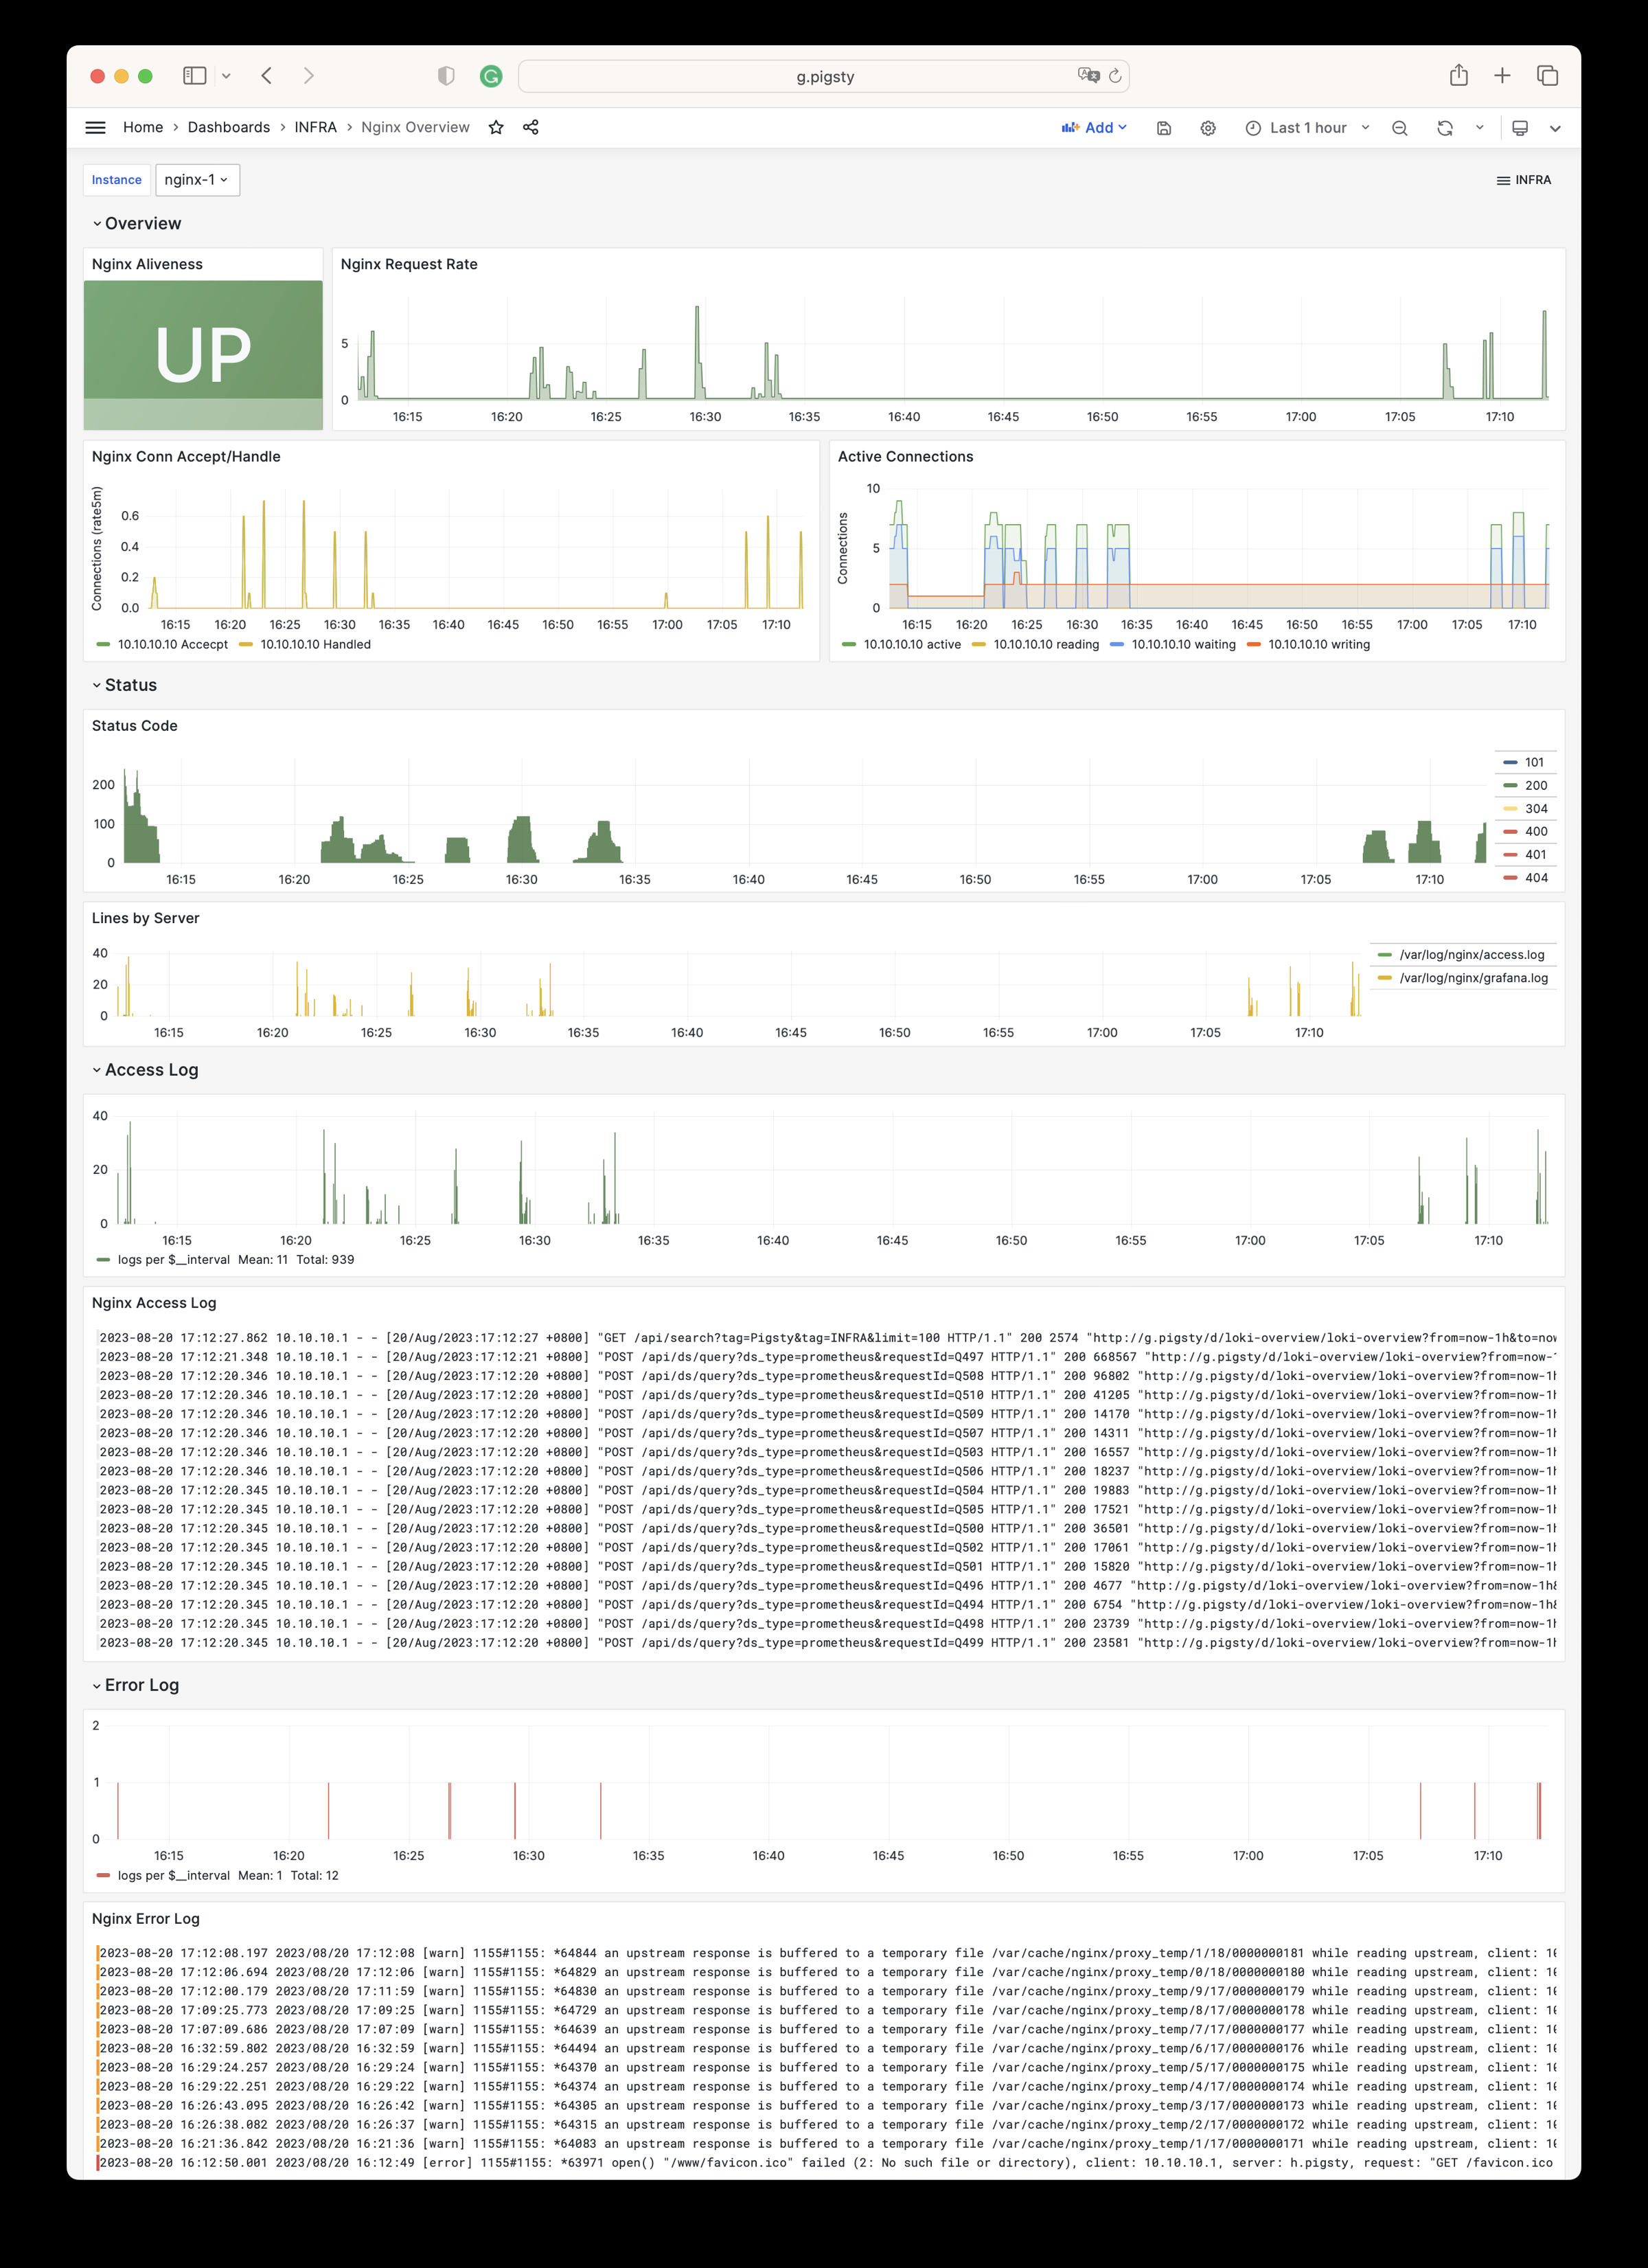
Nginx Overview
Nginx 监控指标与日志
Nginx Overview Dashboard
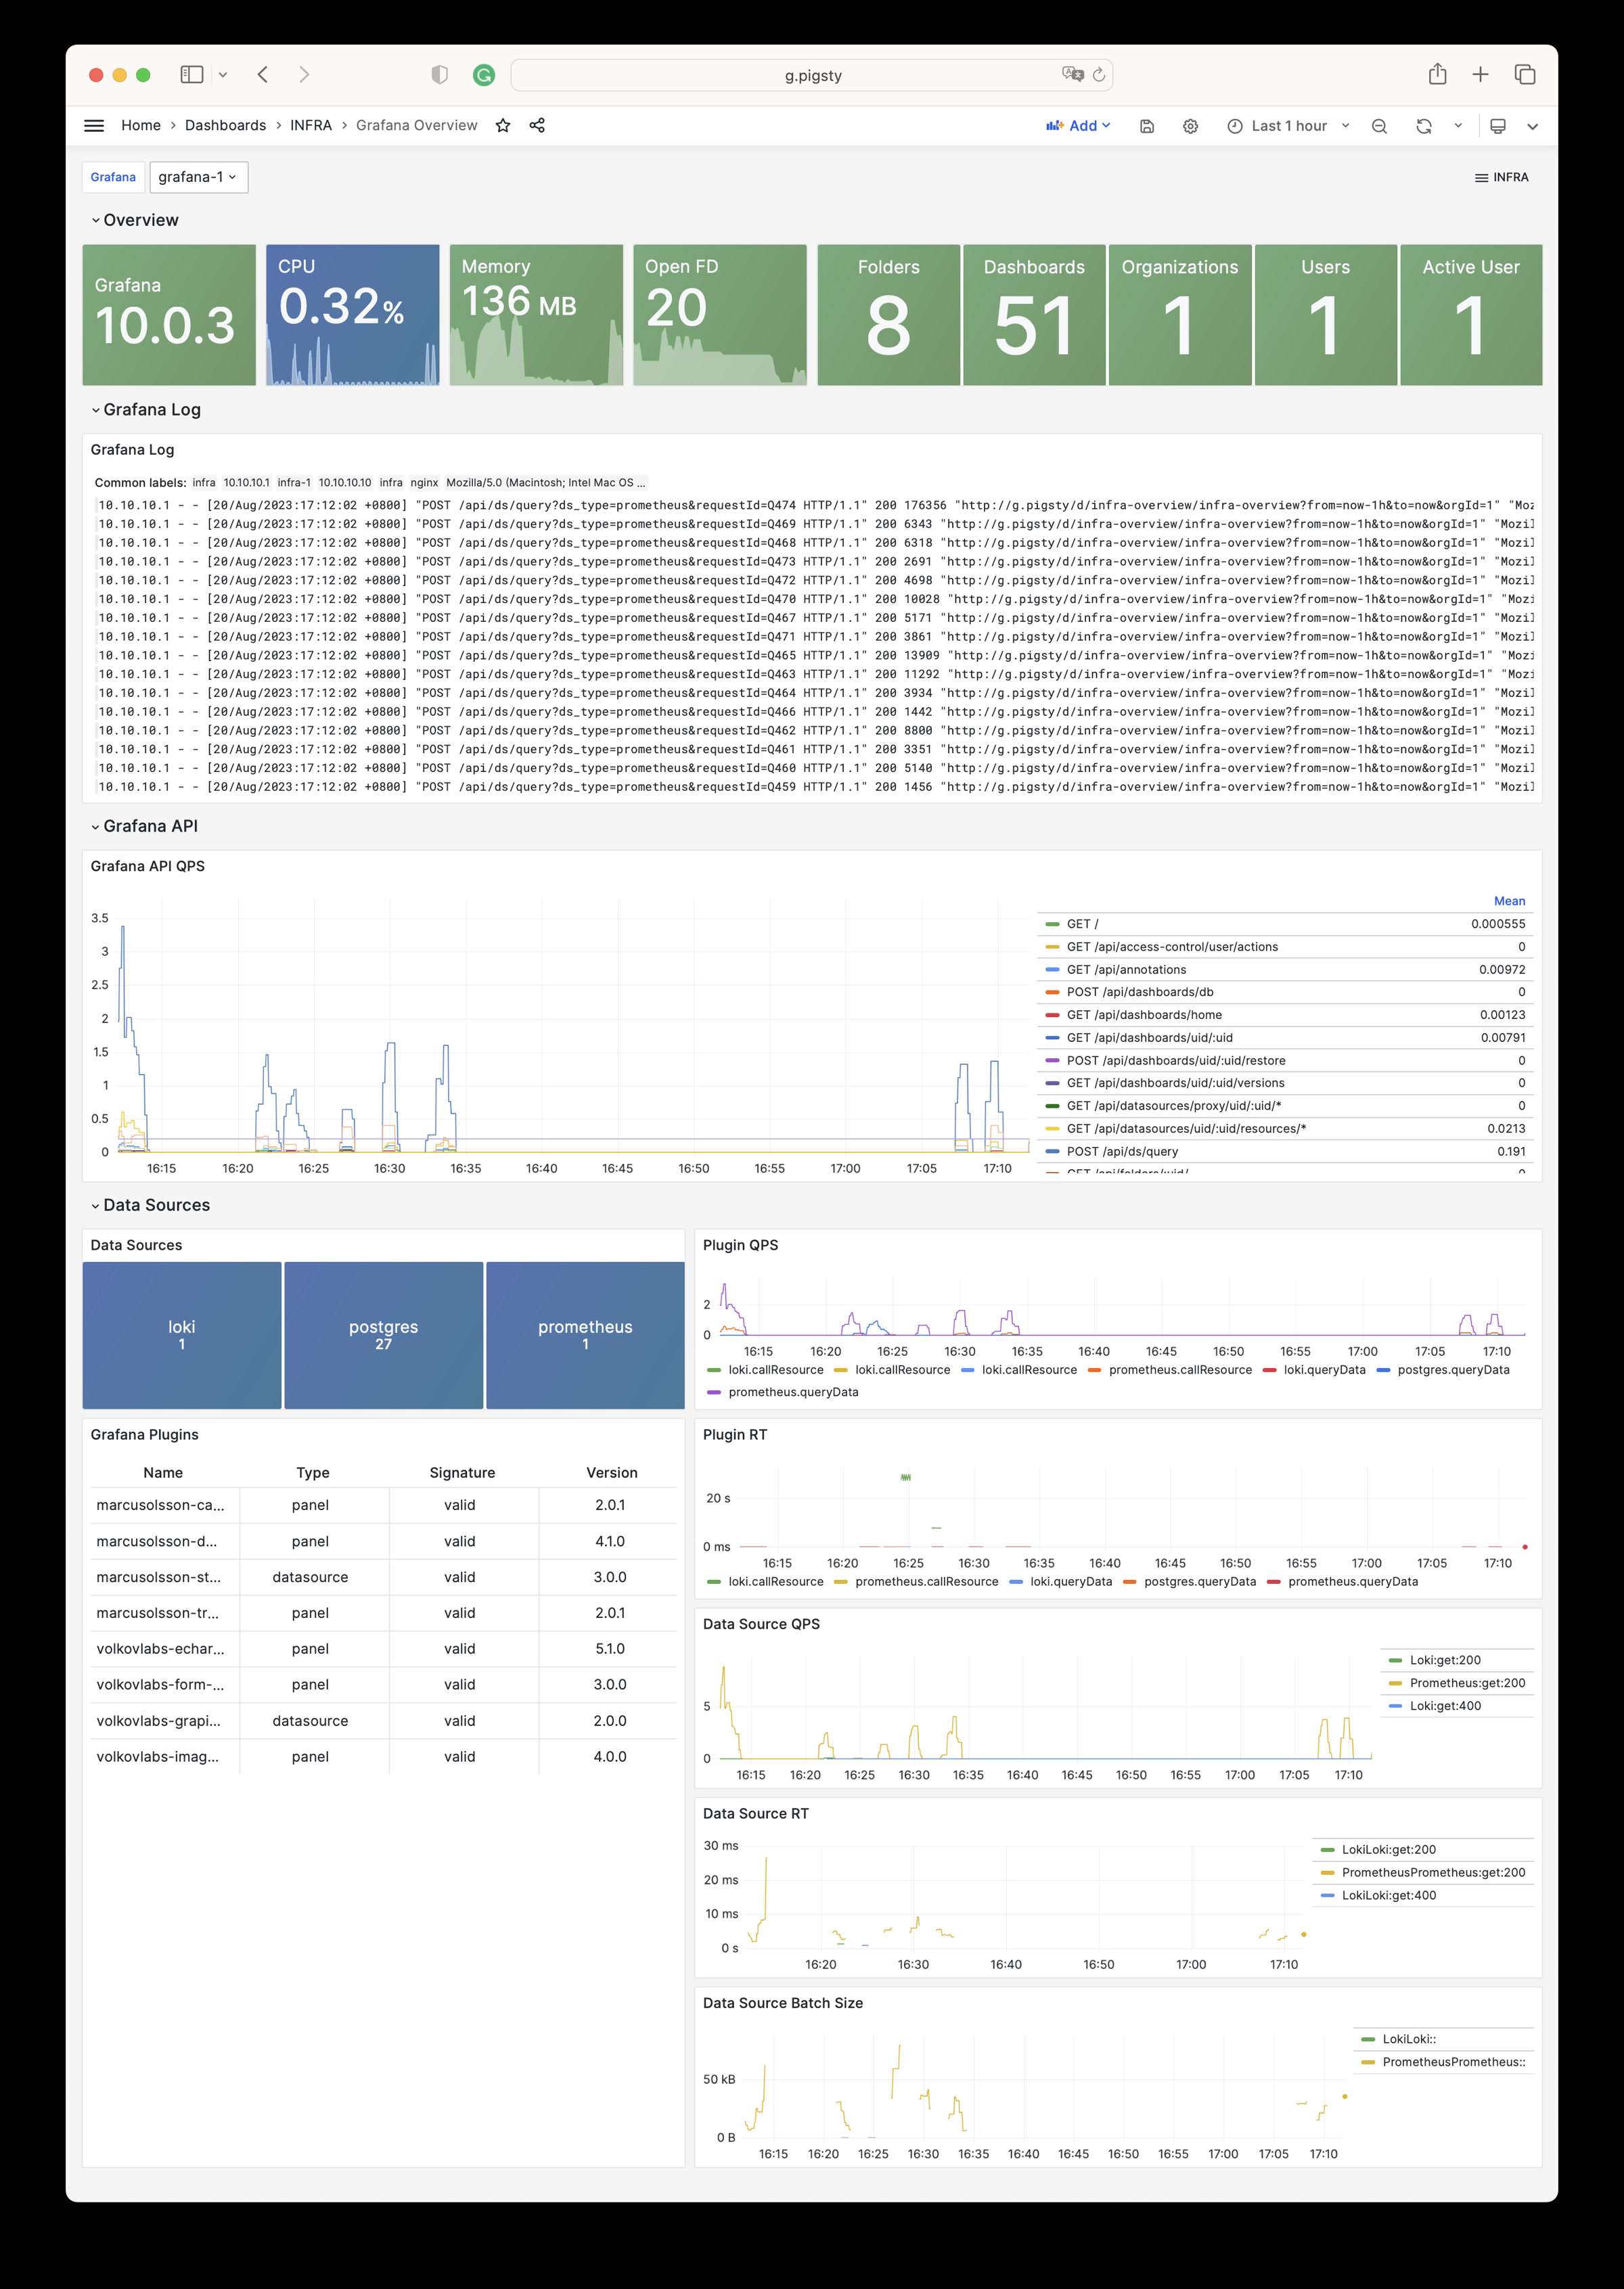
Grafana Overview
Grafana 监控指标与日志
Grafana Overview Dashboard
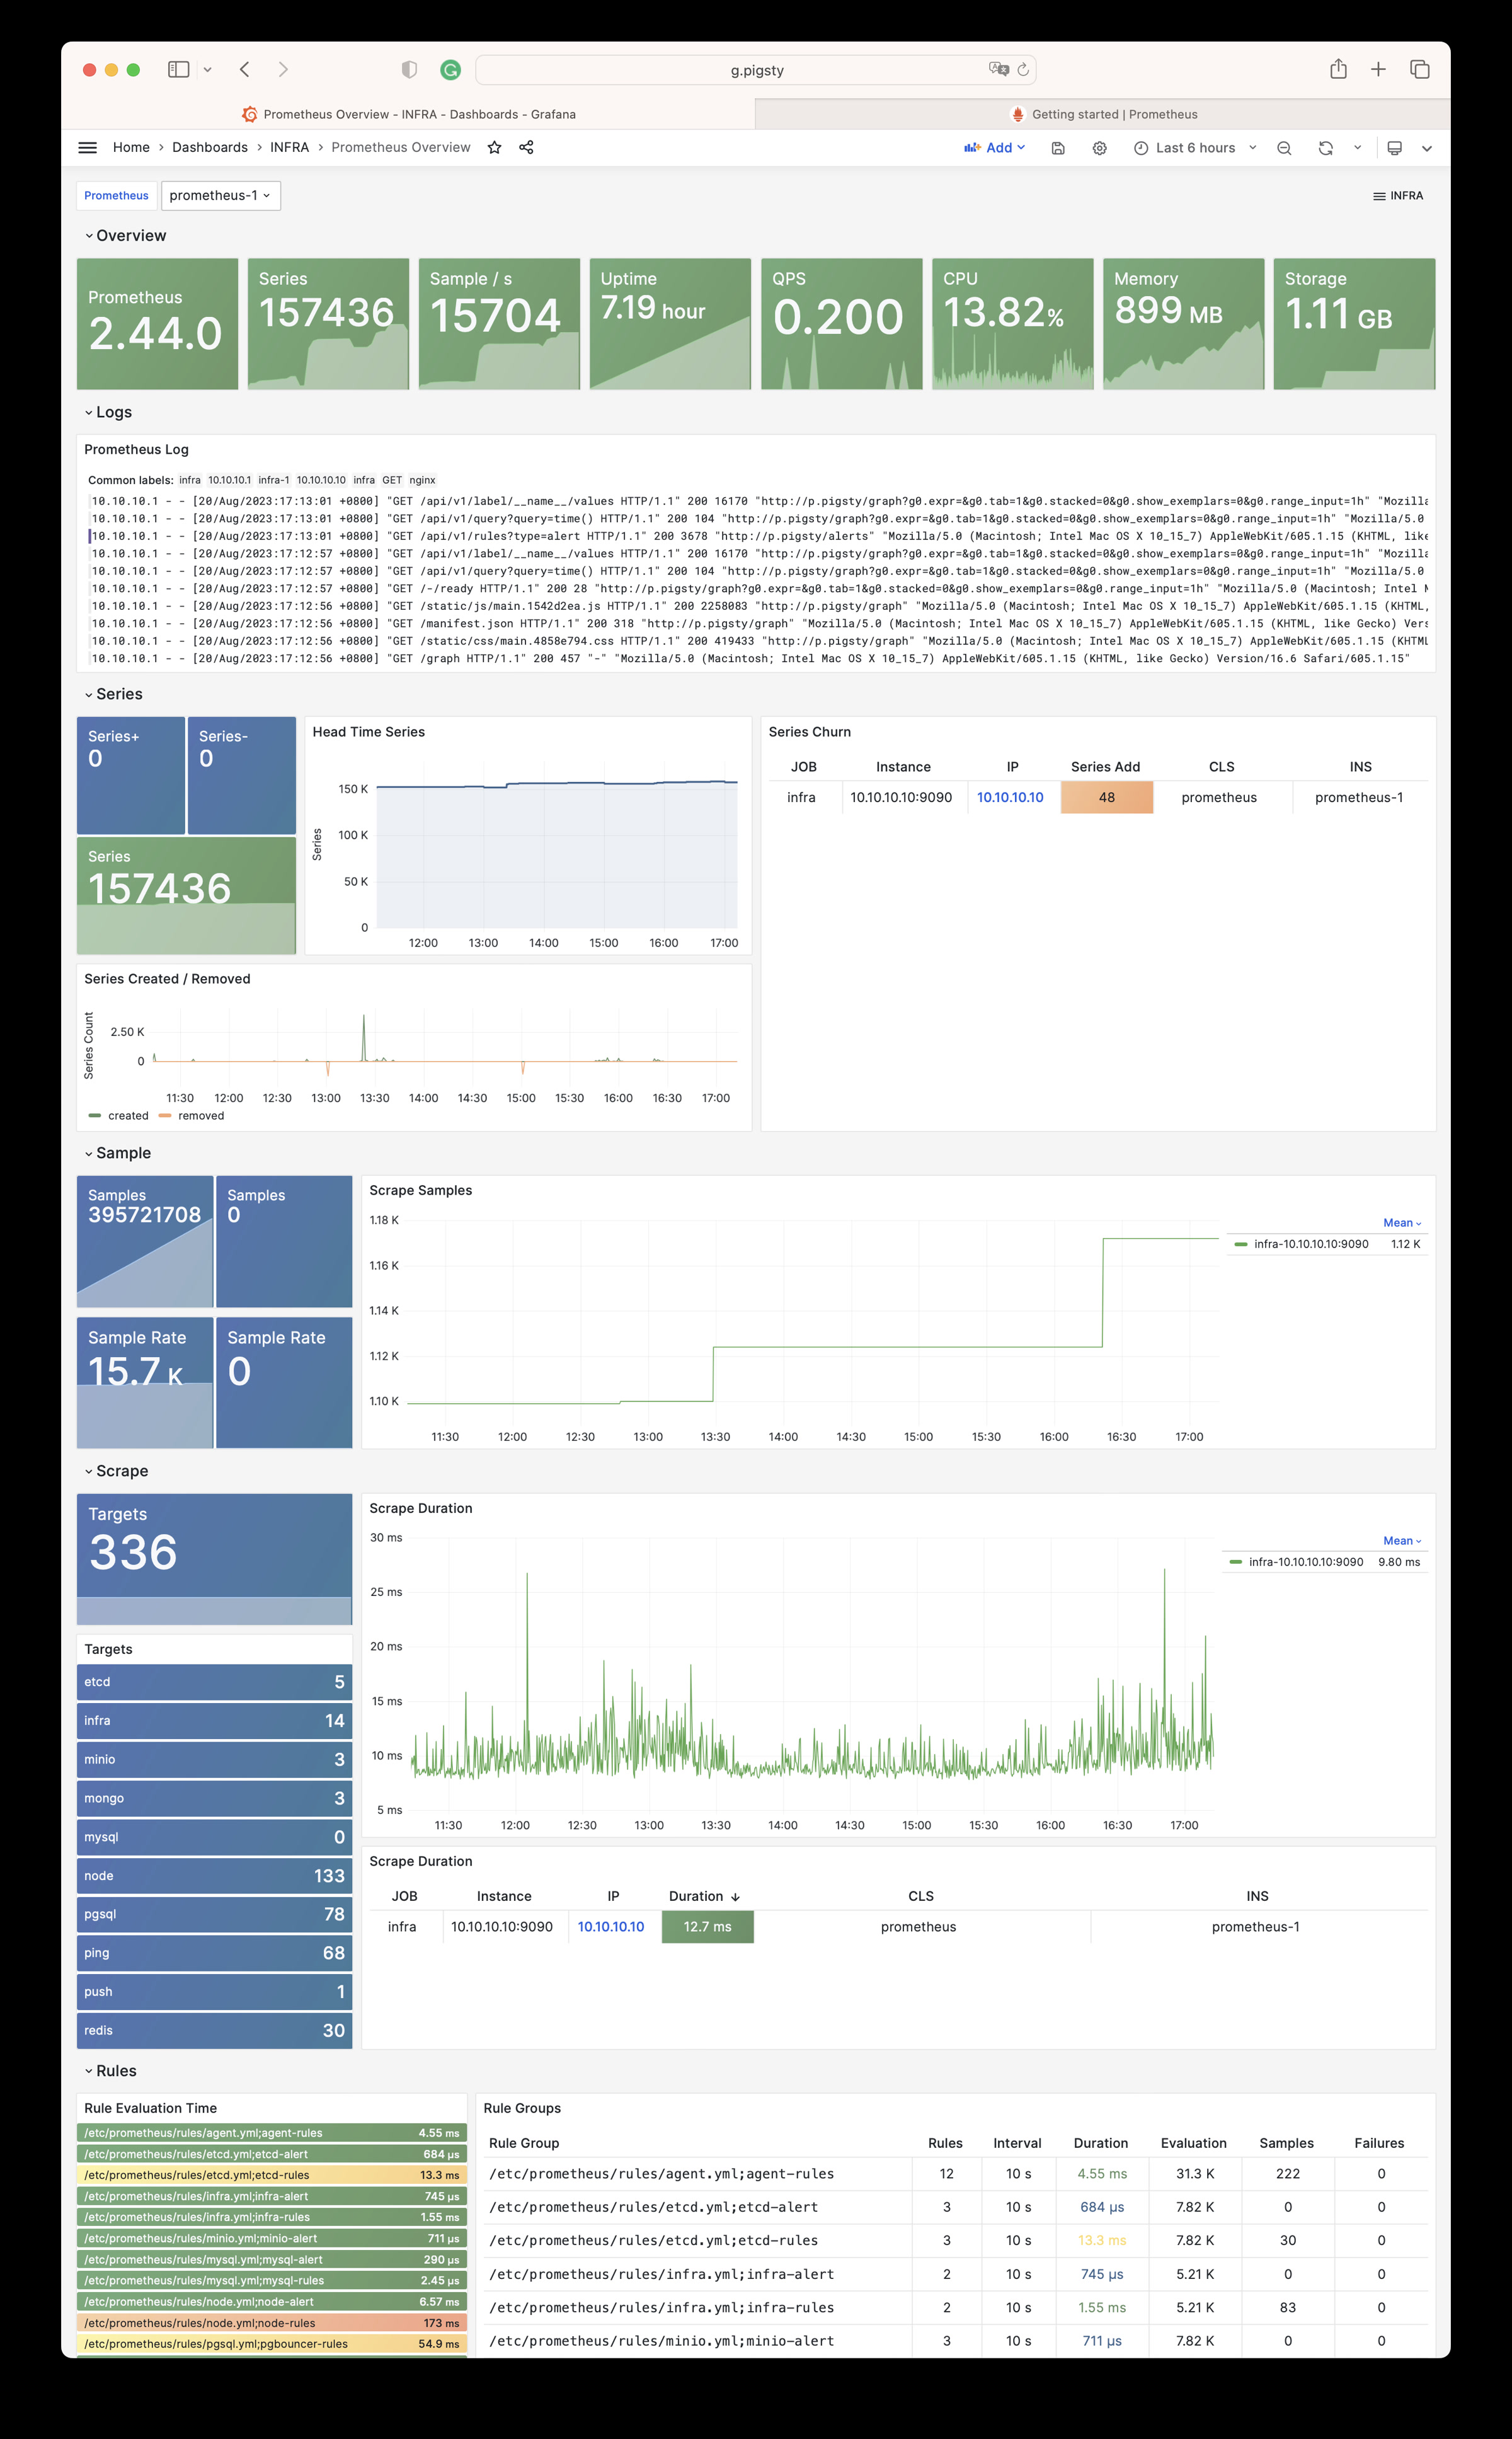
Prometheus Overview
Prometheus 监控指标与日志
Prometheus Overview Dashboard
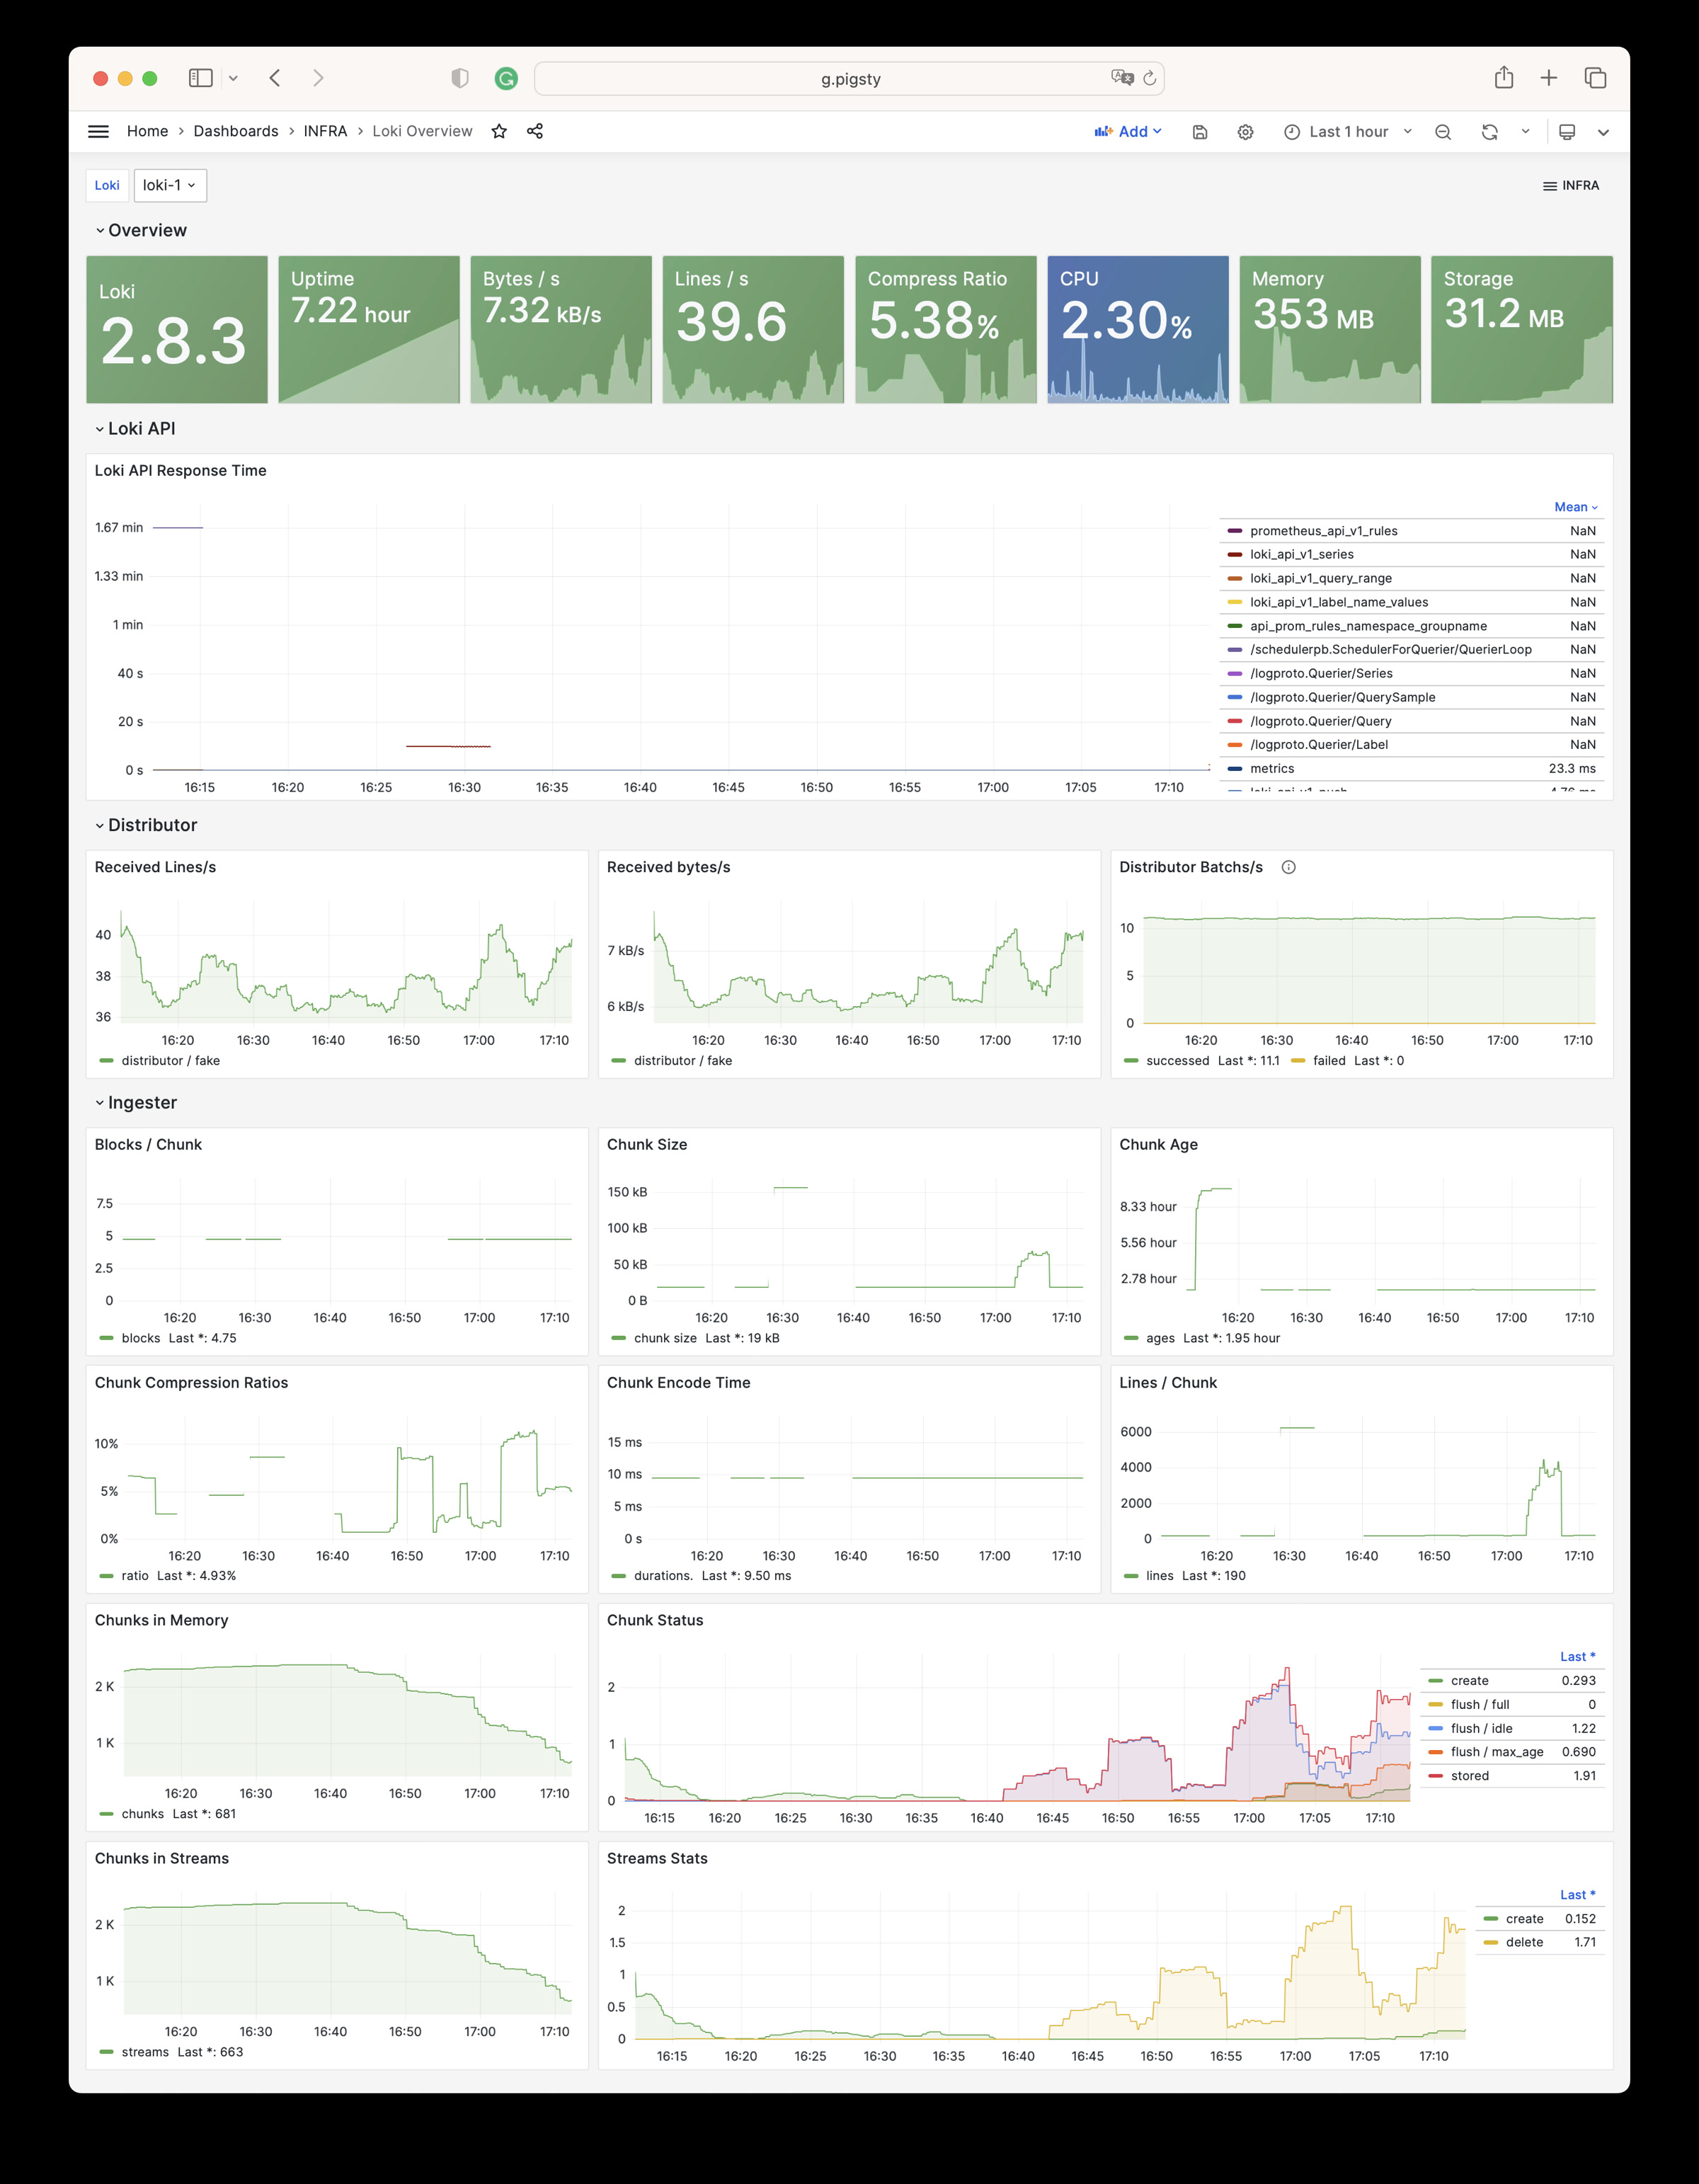
Loki Overview
Loki 监控指标与日志
Loki Overview Dashboard
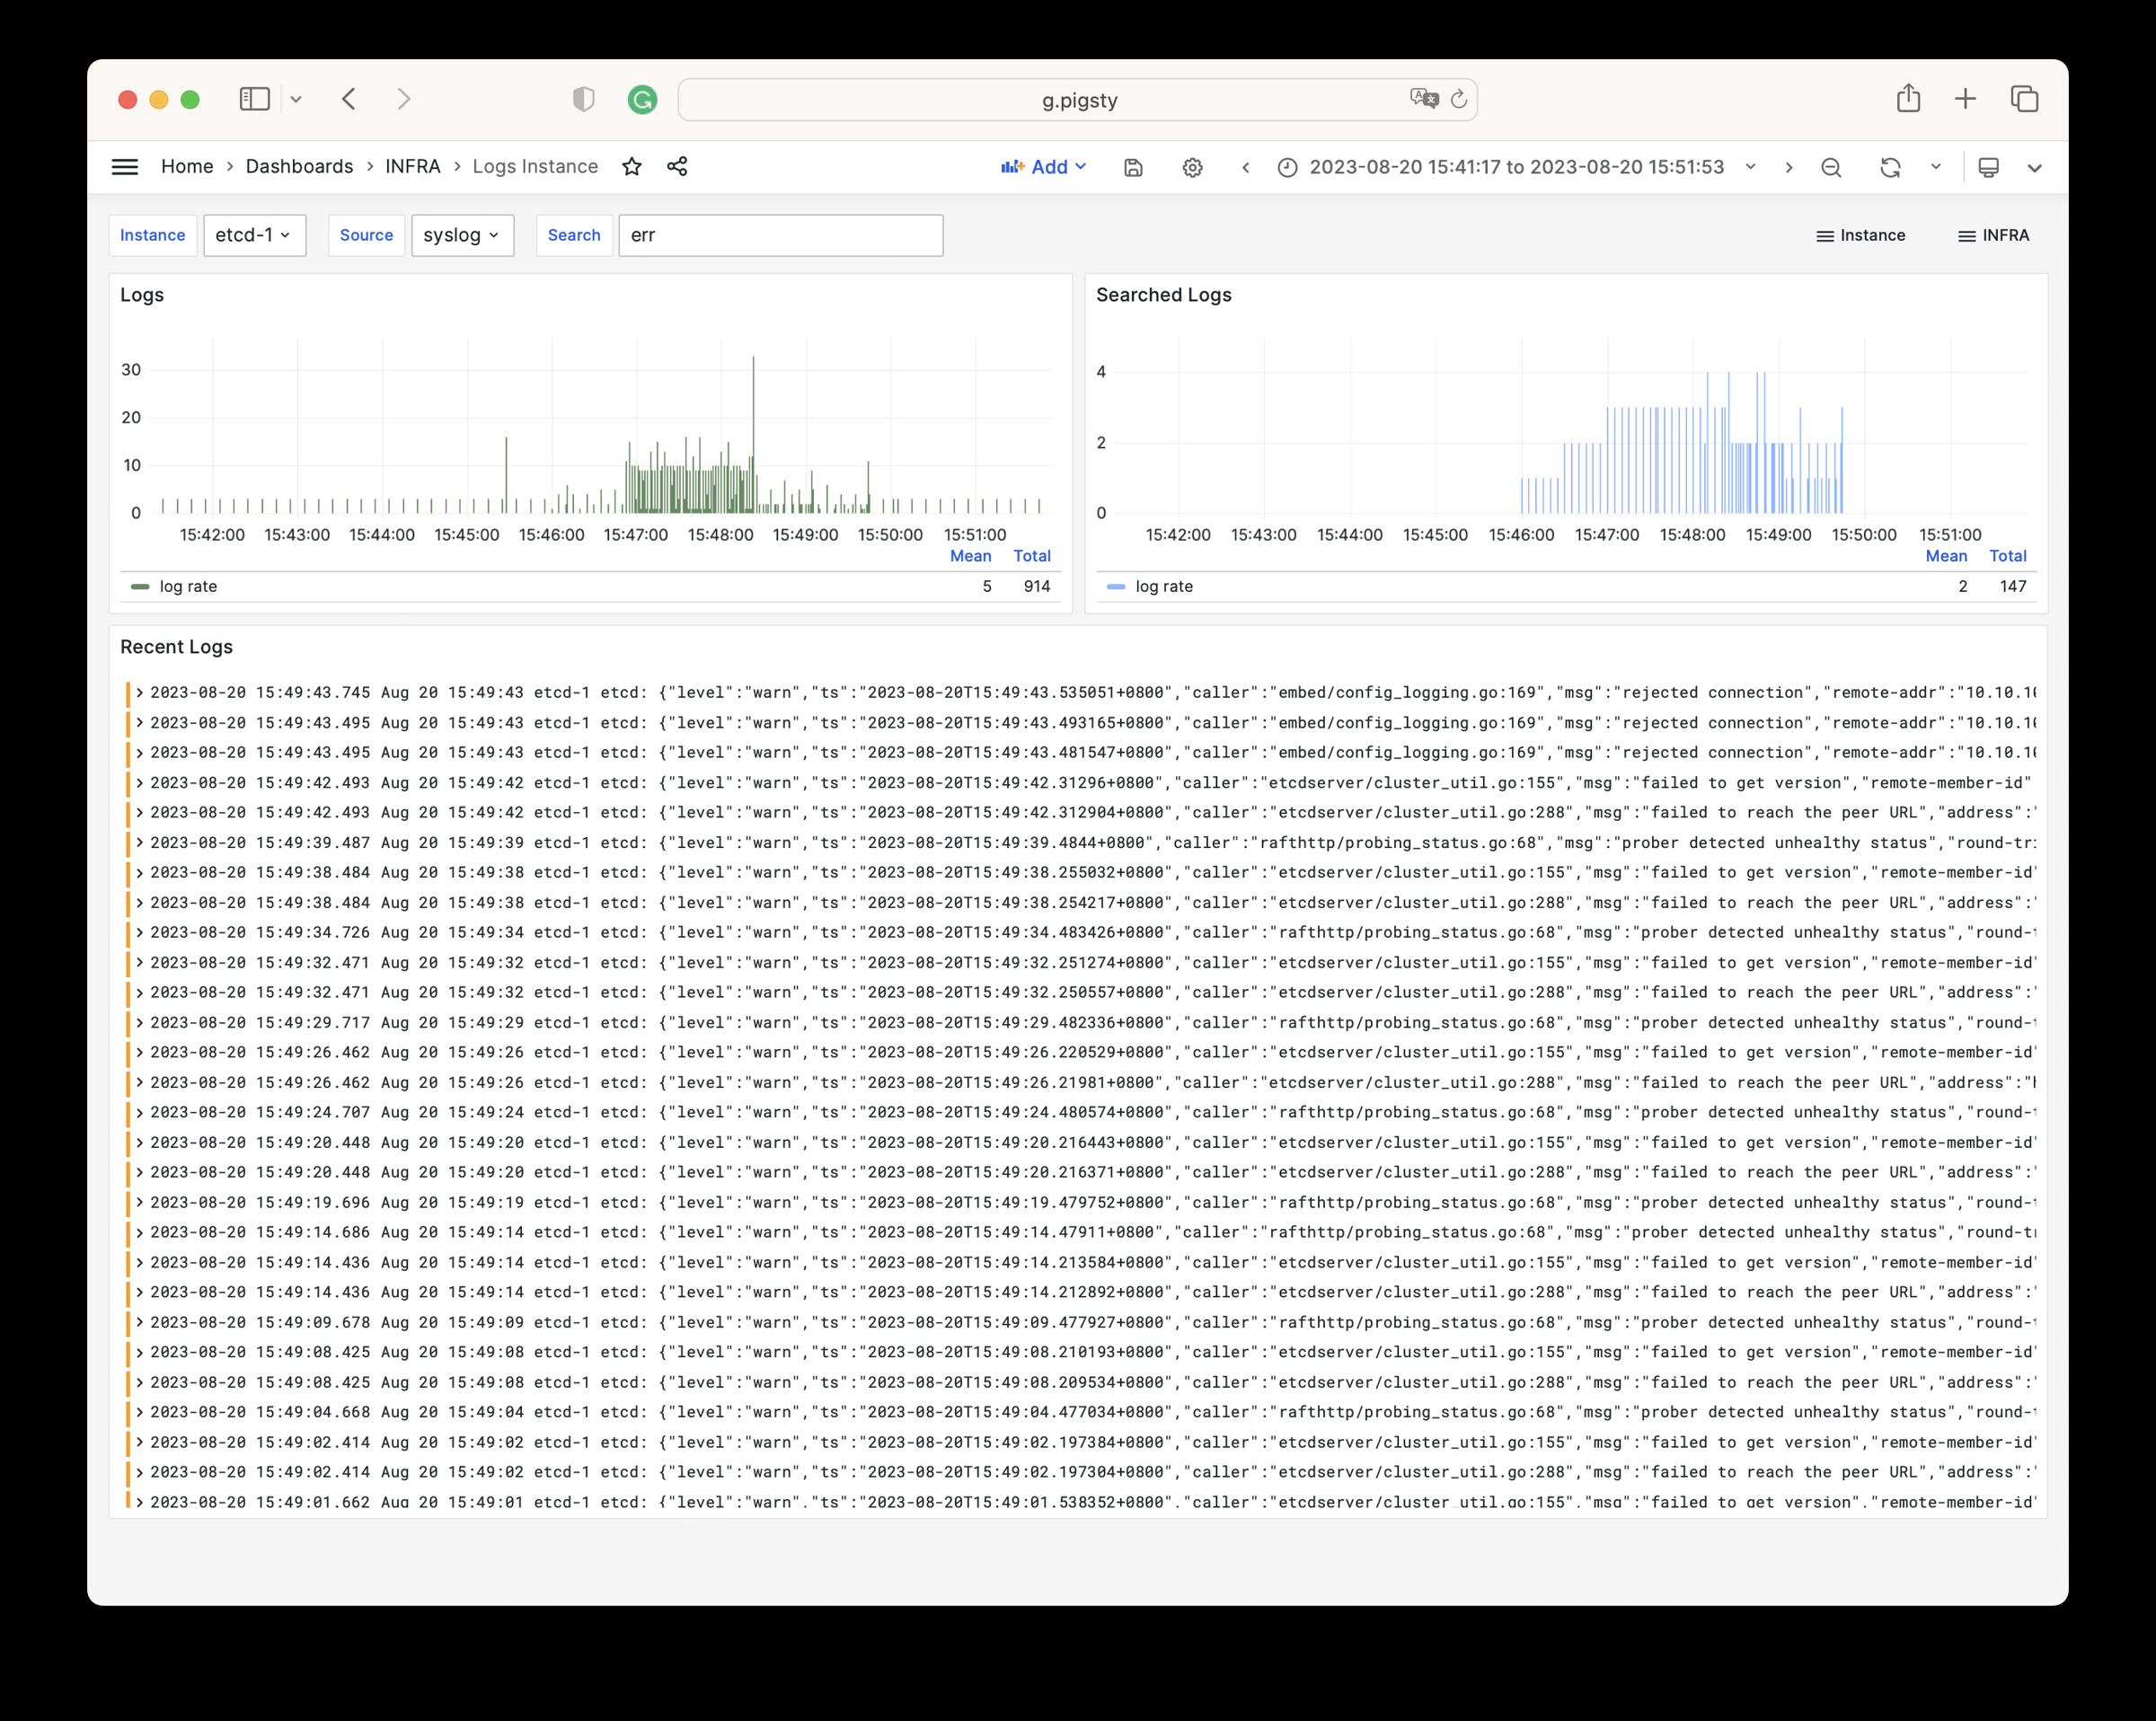
Logs Instance
查阅单个节点上的日志信息
Logs Instance Dashboard
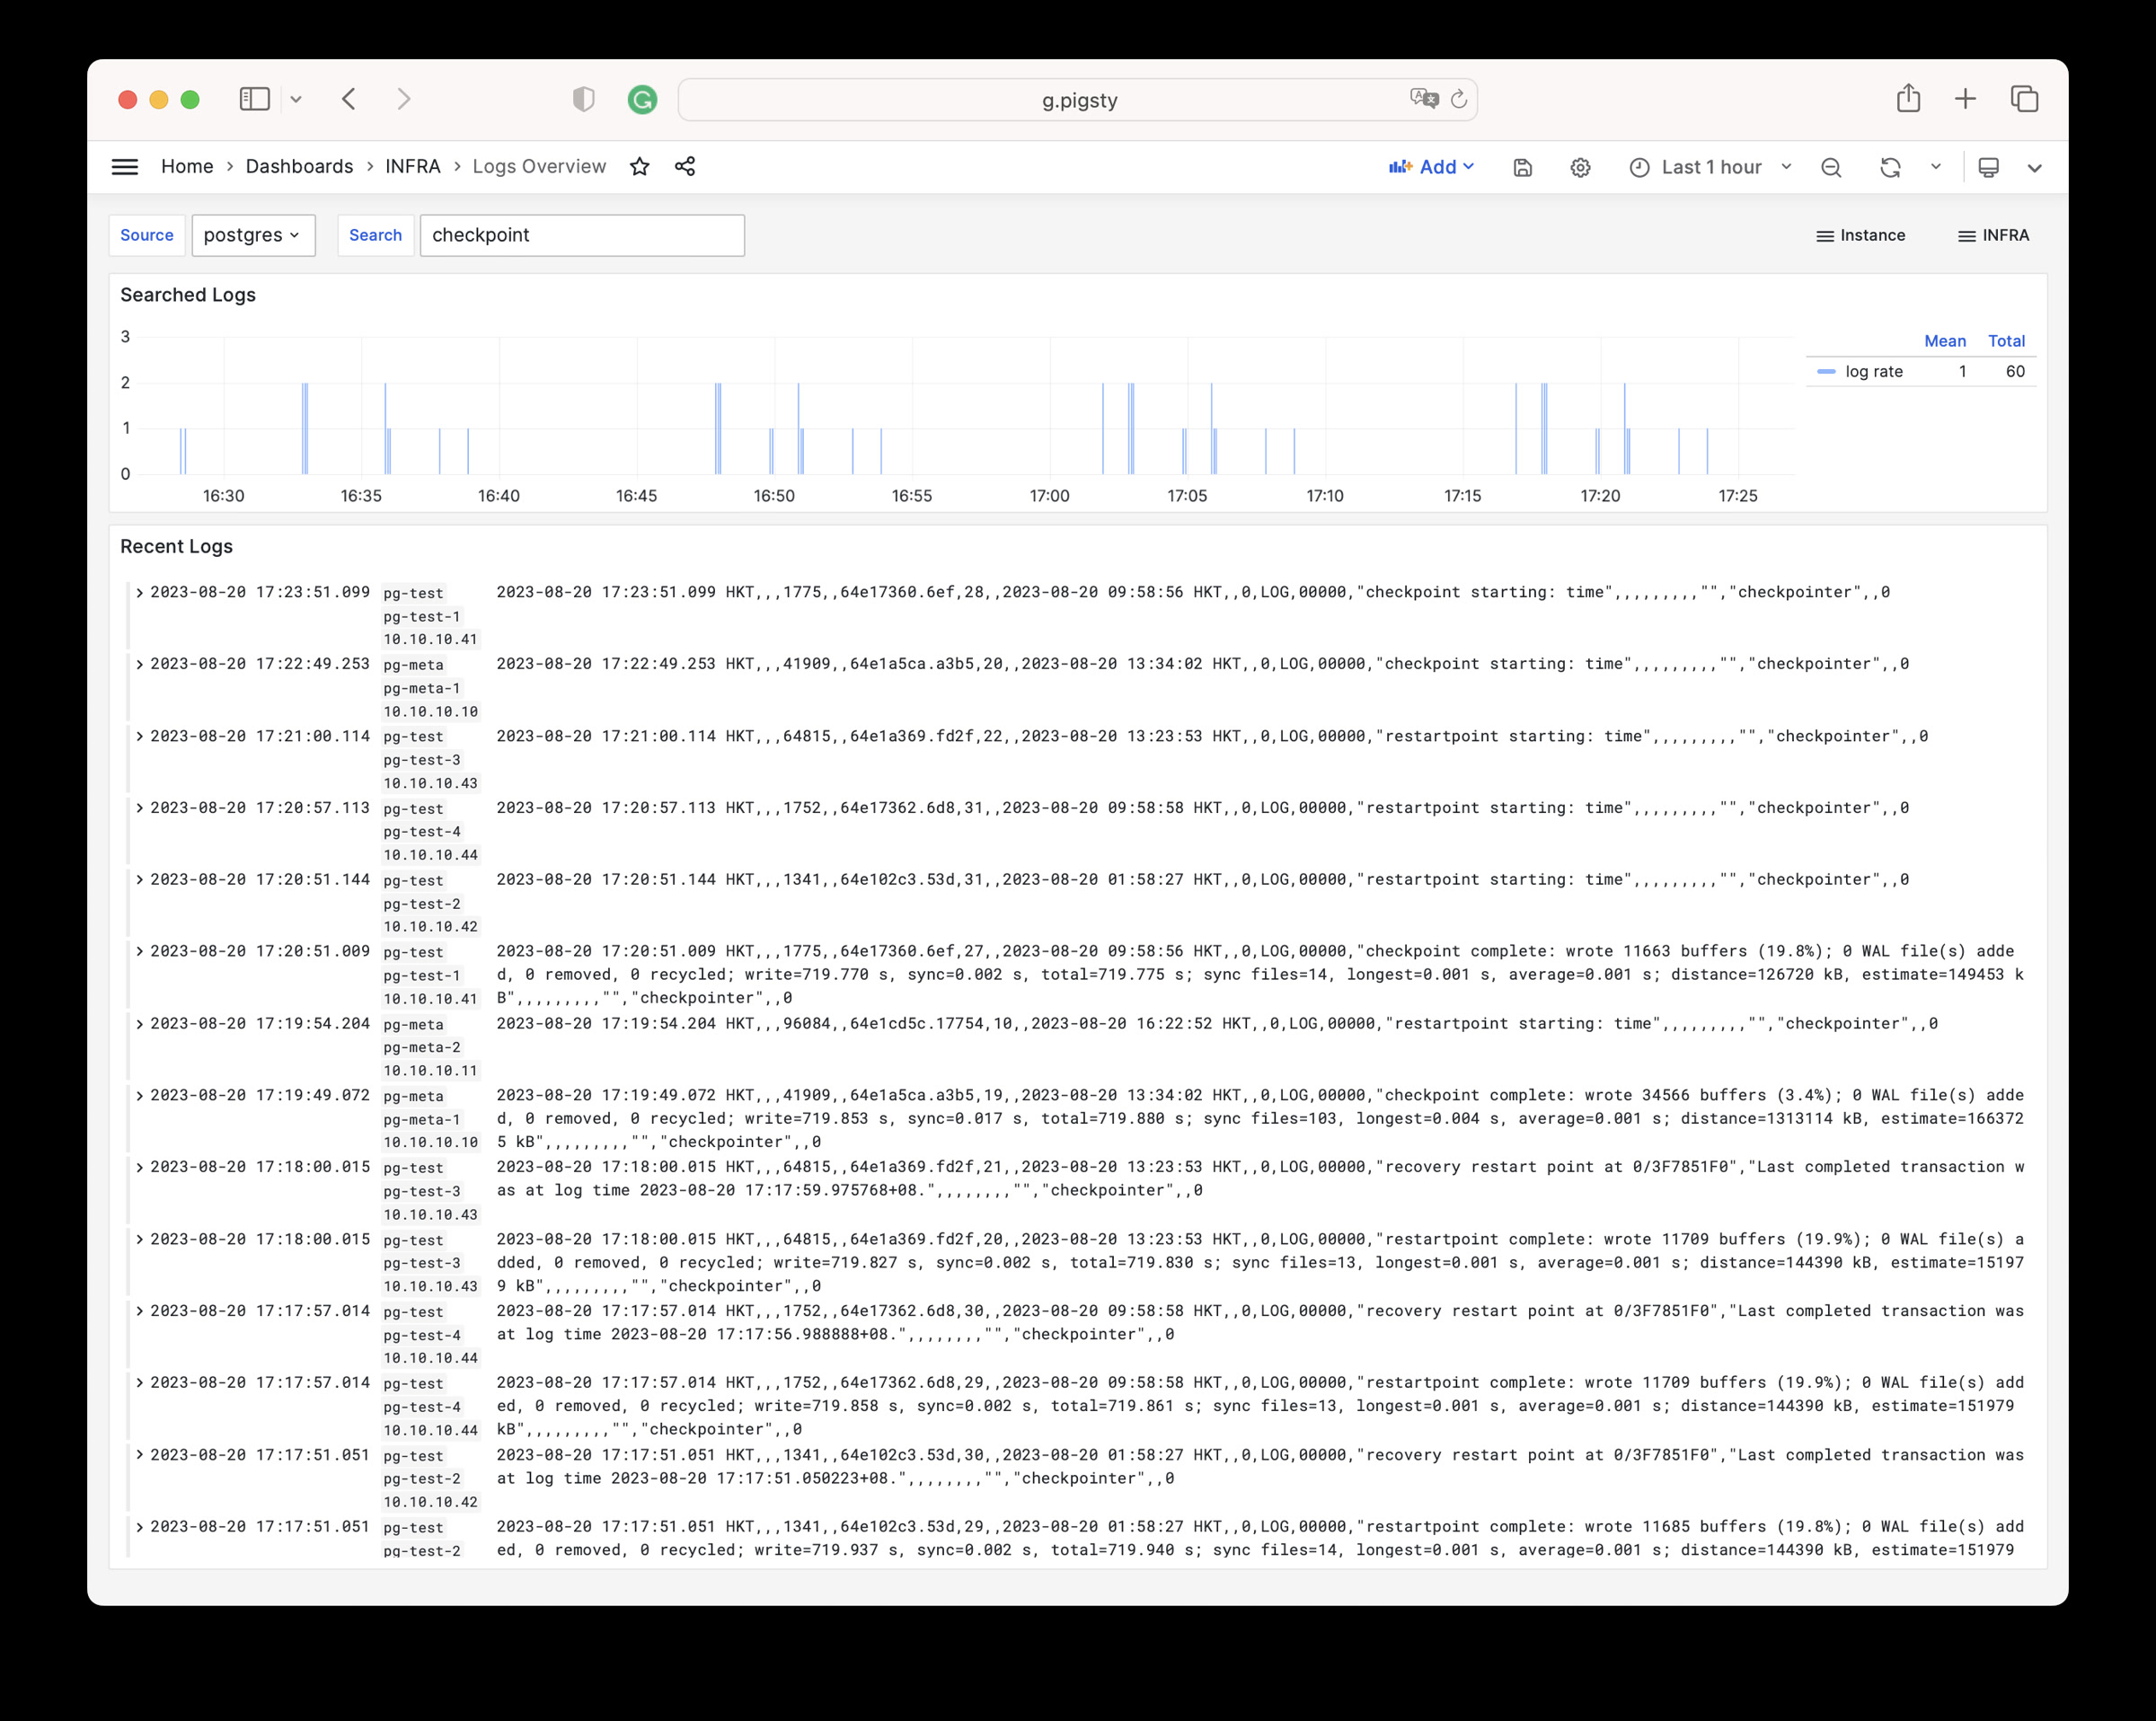
Logs Overview
查阅全局日志信息
Logs Overview Dashboard
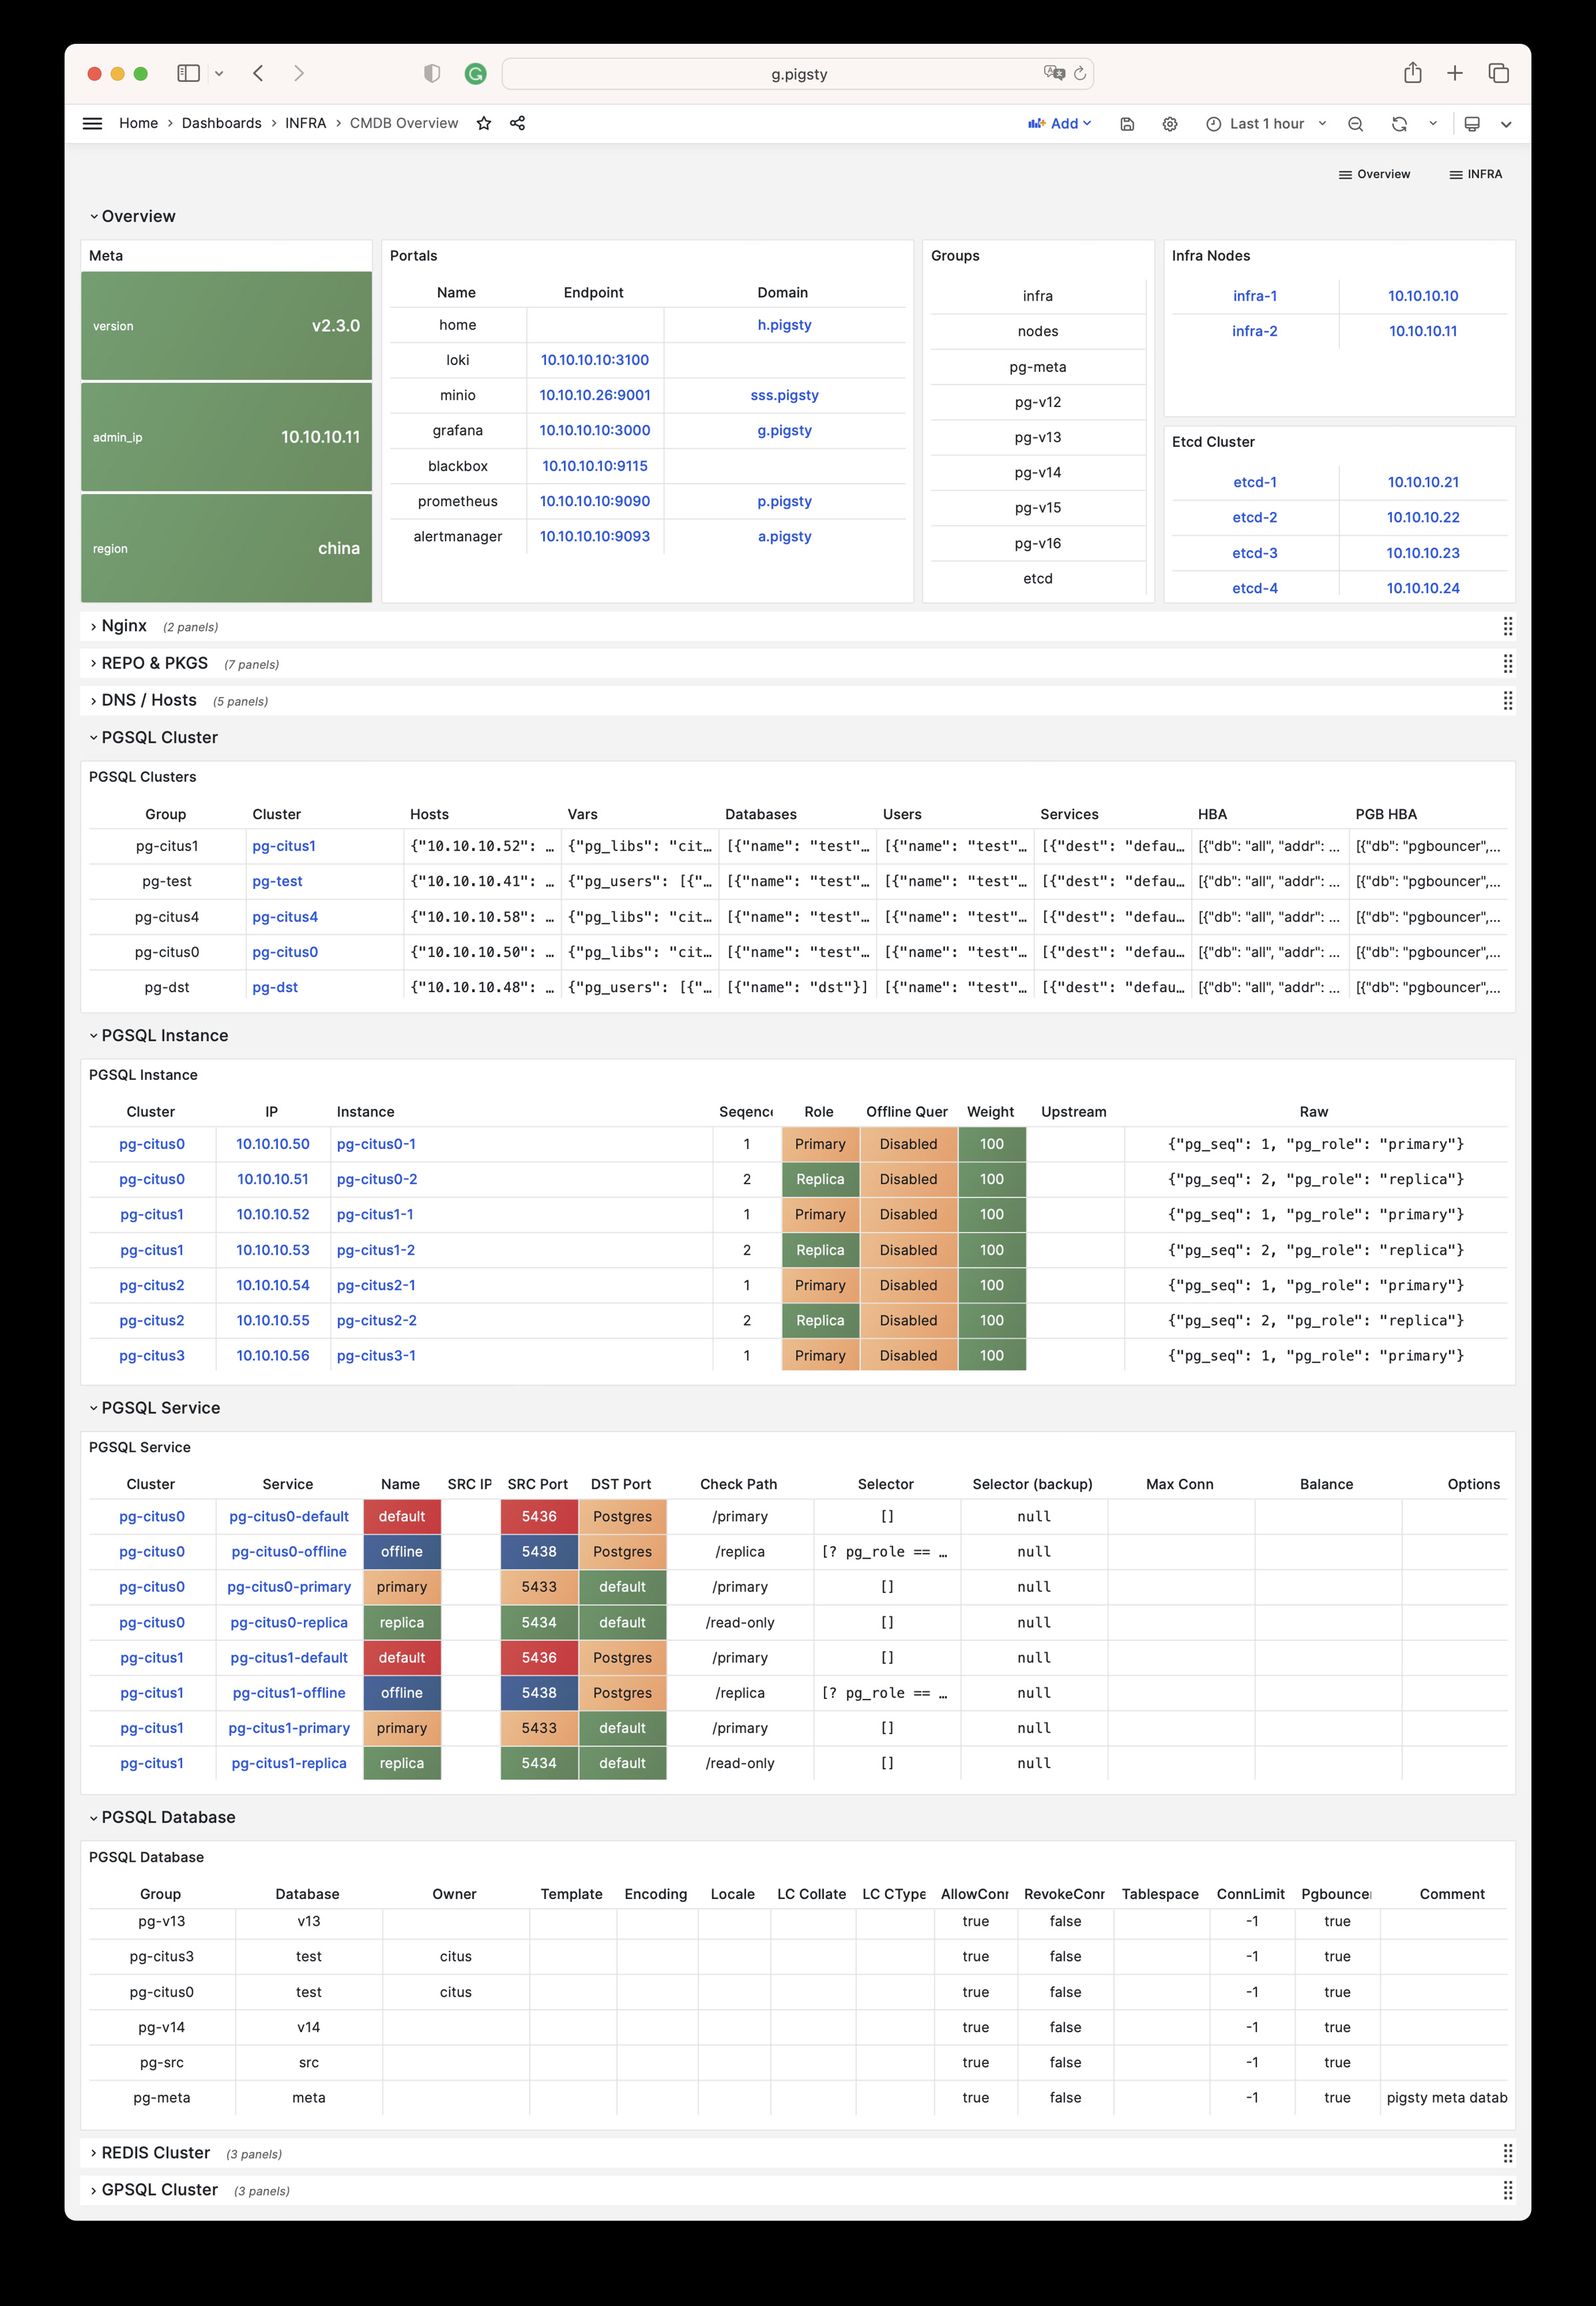
CMDB Overview
CMDB 可视化
CMDB Overview Dashboard
告警规则
Pigsty 针对 INFRA 模块提供了以下两条告警规则:
InfraDown: 基础设施组件出现宕机AgentDown: 监控Agent代理出现宕机
您可以按需在 files/prometheus/rules/infra.yml 中修改或添加新的基础设施告警规则。
################################################################
#                Infrastructure Alert Rules                    #
################################################################
- name: infra-alert
  rules:

    #==============================================================#
    #                       Infra Aliveness                        #
    #==============================================================#
    # infra components (prometheus,grafana) down for 1m triggers a P1 alert
    - alert: InfraDown
      expr: infra_up < 1
      for: 1m
      labels: { level: 0, severity: CRIT, category: infra }
      annotations:
        summary: "CRIT InfraDown {{ $labels.type }}@{{ $labels.instance }}"
        description: |
          infra_up[type={{ $labels.type }}, instance={{ $labels.instance }}] = {{ $value  | printf "%.2f" }} < 1

    #==============================================================#
    #                       Agent Aliveness                        #
    #==============================================================#

    # agent aliveness are determined directly by exporter aliveness
    # including: node_exporter, pg_exporter, pgbouncer_exporter, haproxy_exporter
    - alert: AgentDown
      expr: agent_up < 1
      for: 1m
      labels: { level: 0, severity: CRIT, category: infra }
      annotations:
        summary: 'CRIT AgentDown {{ $labels.ins }}@{{ $labels.instance }}'
        description: |
          agent_up[ins={{ $labels.ins }}, instance={{ $labels.instance }}] = {{ $value  | printf "%.2f" }} < 1